This post is really about how maximum likelihood works. Most of statistics works on this principle including ARIMA models that I describe here.
What is Maximum Likelihood Estimation?
So your first thought is probably, what is maximum likelihood estimation? Well, that is a good question, and if I am honest, even though I took plenty of statistics classes throughout college, it didn’t click for me until I was in graduate school. So I can totally understand if you are confused. Maximum likelihood estimation is a technique that is used to estimate parameters of a probability distribution. That is all there is to it. The details can get a bit murky though. This post is an attempt to make it as easy as possible to understand what is going on.
The first thing to understand about maximum likelihood estimation is that it is all about probability. Specifically, what we want to do, is measure the probability of seeing a particular data point given a particular probability distribution and given the parameters for that probability distribution. And then given that same probability distribution and its parameters, we’ll do that for every single data point that we have.
So at this point, you would have a list of probabilities of your data, but we want to boil all of this information down to a single number. We will consider each data point to be independent (in the probabilistic sense) of the other data points. That will allow us to multiply all of the probabilities together, to come up with the probability of our dataset under the probability distribution that we selected, under the parameters that we selected. This is known as the likelihood of our data. It is where the “likelihood” in maximum likelihood comes from.
Now what we want to do is to try out new parameters for our probability distribution. Then we re-run the analysis in the last paragraph. Finally, we compare the likelihood we get with the new parameters with the likelihood using the old parameters. Did the likelihood of our data go up or down? We do this until we can’t get a bigger likelihood. That’s the “maximum” in maximum likelihood.
At this point you have some parameter values for the distribution that you chose that maximize the likelihood. You can think of these parameter values as an estimate of the true values for the distribution. Thus you have a “maximum likelihood estimate”. And we call this process “maximum likelihood estimation”.
A Little Trick to Make it Easier
There is one little trick that will make this whole process easier that I omitted from the description above. Those in the know probably have already figured it out. The problem is that we are going to multiply a percentage by other percentages a bunch of times. This process will generate a very small number. Computers, may have a hard time distinguishing between small numbers due to precision errors.
So instead, we typically take the natural logarithm of each probability, and add them together instead of multiply. We can get away with this because taking the log is a monotonic transformation and thus doesn’t affect the parameter estimates.
An Example of Maximum Likelihood in Python
I’ve attempted to give you the intuition behind the theory above. However, I think that seeing some code might give a better understanding.
from scipy.stats import norm
from scipy.optimize import minimize
These are the two import statements that we will use. I’m going to use the norm class to generate some phony data. It will be normally distributed with a mean of 100, and a standard deviation of 15. We will generate 1000 observations. Finally, so that you can follow along at home and get the same results as me, we’ll give it a random seed. You can change it if you want, but your results won’t match mine if you do.
data = norm.rvs(loc=100,scale=15,size=1000,random_state=1)Now we need to write a function that takes in parameters and data, and spits out likelihoods. As mentioned above, we’ll make it spit out the natural log of our likelihood instead of the actual likelihood.
def likelihood(params,data):
    return norm.logpdf(data,loc=params[0],scale=params[1]).sum()
Let’s get some intuition for how this likelihood function behaves. I’m going to hold the scale parameter constant and vary the location parameter. We’ll plot the likelihood against the location parameters that we choose. Here’s the code to generate the plot:
x = np.linspace(70,130,1000)
y = [likelihood([val,15],data) for val in x]

plt.plot(x,y)
plt.title('Demonstration of Maximum Likelihood')
plt.ylabel('Log-Likelihood')
plt.xlabel('Mean Parameter Value')
plt.show()
As you can see, the log-likelihood for this data is maximized when we set the location parameter (mean) value to something close to 100. You can modify the code above to generate a similar plot for the scale parameter (standard deviation). If you did, you would see that it gets maximized when you set it to about 15. I will omit the code here, but this is what it looks like.

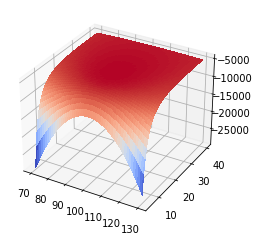
You can see that it reaches a maximum around 15 but the slope isn’t very steep. This next plot shows the likelihood surface for both the mean and standard deviation. All this is doing is recognizing that you have to account for both parameters at the same time. Here is the code:
X = np.linspace(70, 130, 100)
Y = np.linspace(5, 40, 100)
xv, yv = np.meshgrid(X, Y)
Z = np.array([likelihood([x,y],data) for x,y in zip(xv.flatten(),yv.flatten())]).reshape(xv.shape)
fig, ax = plt.subplots(subplot_kw={"projection": "3d"})


surf = ax.plot_surface(xv, yv, Z, cmap=cm.coolwarm,
                       linewidth=0, antialiased=False)
Optimizing The Likelihood Function
So far, I haven’t really found the maximum likelihood estimates. We have just created a likelihood function, and plotted it. Now we need to bring the might of calculus to bare on the problem of finding the actual maximum likelihood values. We will use gradient descent methods baked into scipy and python in order to do this. I would recommend spending some time with a good calculus book if you don’t understand these methods, but for now we will take them for granted as wizardry. The only thing that I will say is that the method will minimize a function. So in order to maximize we need to multiply be negative one.
def neglikelihood(params,data):
    return -1*likelihood(params,data)
result = minimize(neglikelihood,[50,10],args=(data))
Notice that we need to give the minimize function an initial guess. Here, I told it that I think the mean will be 50 and the standard deviation will be 10. I also supplied my data as an argument for the neglikelihood function. If you look at what is in results, you get a lot of very useful information:
fun: 4395.492201331235
 hess_inv: array([[ 0.61160768, -0.11913108],
       [-0.11913108,  0.15536552]])
      jac: array([0., 0.])
  message: 'Optimization terminated successfully.'
     nfev: 488
      nit: 18
     njev: 122
   status: 0
  success: True
        x: array([100.7762513 ,  19.62007857])
The last value, x, gives you the maximum likelihood estimates. They are pretty okay. I got a mean of 100.77 and a standard deviation estimate of 19.62. I would say that’s pretty decent.
The “fun” value is the maximum likelihood value. From this value we can say something about how likely our data are given these parameter values.
Another interesting value is the “jac” array. This is the estimated jacobian of our likelihood function evaluated at the optimal parameters in x. We want these values to be as close to zero as possible. This would indicate that we are at least at a local minimum or maximum.
The last value is probably the most interesting, the “hess_inv” array. “hess_inv” stands for inverse hessian. A cool thing is that since we optimized a negative likelihood function the inverse hessian has a special meaning. It is an estimate of the standard errors around the maximum likelihood estimates. In particular, if we divide our maximum likelihood estimates by the diagonal elements of this matrix, we get t-statistics for the estimates. We can then derive p-values, and statistical significance from these values.
The t-statistics for our two parameters are given by:
result.x/np.diagonal(result.hess_inv)Making Things More Complicated
You can then make everything as complicated as you want. For example, you can make the mean depend on another piece of data, that would be known as a regression. Perhaps you want to swap the normal distribution for another one? Maybe you can make the distribution a convolution of multiple distributions that are conditional on data? That would be pretty complicated but go for it. You can make the mean, non-linear with respect to parameters, you can make the standard deviation conditional on the data too. Really, the sky is the limit at this point.
If you can dream up a strange likelihood model, you can in principle estimate it by just messing around with the code. Since there are literally infinite models that you can dream up, I won’t try to give you examples. But feel free to contact me if you want a customized model. My number is +1 801-815-2922.
The full code for this model can be found here.
Leave a Reply