I was sitting here, at home, locked away, being socially distant, and I got to thinking, “What is the point?”
So I started to read a bunch about the data, and the algorithms, and the point behind social distancing. I’ve got good news, and I’ve got bad news about our new national pass time of cowering inside of our houses. Before I jump on the data science bandwagon for coronavirus, let me tell you, none of this is my own thinking. Sure, a lot of the commentary is mine, but much of the credit goes to the blog posts that I have been reading. Make sure to click the links and read the originals.
Forecasting with SIR models
First of all, the epidemic is getting bad where I am at. I stole the model found here. I modified it to work with Utah data, since that is where I am. And daily as new numbers have come out, I have been watching to see how the forecast changes. I’ve been monitoring the predicted values of the cases, with the actual case counts day after day. Here is the good news, the curve is flattening out. Here’s the bad news due to the lagging dynamics because of the incubation period of the virus, the model is predicting that there are about 10 times the number of diagnosed cases as diagnosed cases running around Utah at this very moment. That is horrifying! These people are potentially infecting other people, and they might not even know that they are sick.
Now, I’ve been adding data into the files for Utah each day. But you can see the curve flattening out by truncating the data, and then rerunning everything. Here’s the thing. Unless the social distancing really starts to kick in, and the curve starts flattening out a lot more than it has, we’re screwed. I’m not even joking, these models are telling us that the entire population of Utah will be infected by the end of next month. No joke, it will be over by may thousands dead. However, there is one saving grace, remember, the incubation period means that it will take around 2 weeks to see any effect. Therefore, we won’t know how well our social distancing efforts have been until they have been in force for about 2 weeks. At the time of writing, that is next week. Hopefully, we’ll see some massive declines in the infection coefficients next week. If I do, I will let you know.
In addition to these models, I found a really nice kaggle notebook. I think this one is worth a read in terms of the modelling of the pandemic. This notebook gives you insights into some models that are a little bit more complicated than your basic SIR model. In fact, this notebook also has a model that explicitly accounts for quarantine. I take issue with these models in that they do assume that there is some constant rate of quarantine, exposure, etc. That isn’t the case, as we can see different strategies being employed across the world at what works and what doesn’t work. However, the fact that these models “care” at all about these factors make them more useful than a simplistic SIR model.
The upshot that I got from this model is that with quarantines, we will be able to flatten the curve. According to this model, we would, peak around 103 days after the onset, with around 4.08% of the population being infected at the same time. For Utah that would mean that we would peak out around June 20th, with around 130,000 people infected. Below, let’s take that as our estimate assuming that we’ve flattened the curve, and that social distancing will be effective. I do like to be optimistic.
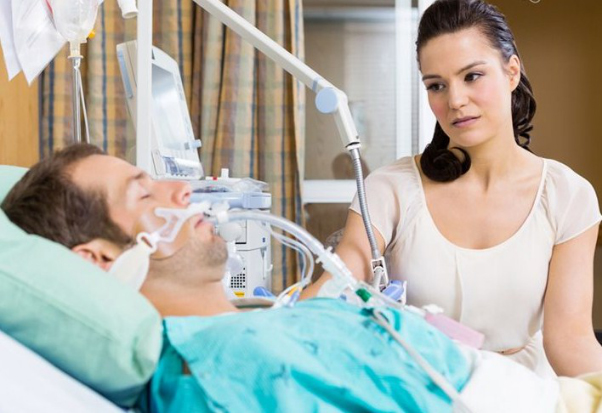
Ventilator Estimates
Rather unsurprisingly, hospitals are being a bit cagey about how many ventilators that they have available to them. Here in Utah, no hospital was willing to go on record from one news report about how many they had. However, we do have an idea nationally how many ventilators exist. The New York Times pegs the number of ventilators available nation wide at about 160,000. With Utah having about 1% of the nations total population. Let’s assume that Utah has about 1% of these ventilators. That gives Utah a depressing 1600 ventilators to work with.
Now in the numbers that we figured above, our best case scenario is that we will have at most 130,000 people sick with COVID-19 in Utah at the same time. Let’s assume for a moment that 1 in 5 will need hospitilization, and that of those another 1 in 5 will need a ventilator (or 1 in 25 of the sick people will need a ventilator).
That would mean that at our peak in the best case world, we would “only” need about 25,000 hospital beds and about 5000 ventilators. That’s not good. We will be shy by about 3400 ventilators. Remember, this is the best case with the least rationing of these devices. Even if it is only 1 in 10 hospitalizations require a ventilator, we will still have a deficit of about 900 respirators. No matter what, PEOPLE WILL DIE. We don’t have what we need to keep them alive. I mentioned how many hospital beds that we will need. We need 25,000 beds in this scenario we have around 5000. No one is talking about this fact, even if we flatten the curve, the hospital system is going to get overwhelmed. And this is our most rosy, the best case result that we can hope for.
But it also means that we need to be prepared to social distance for a very long time. In order to get to this point we need to social distance for the better part of a year, 103 days to the peak and another 103 days to the end of the pandemic, that’s 206 days! We have to do this social distance thing until October 3rd.
We’re pretty much screwed. This is one prediction that I hope I am utterly wrong about.
So stay safe out there. Stay healthy. You may be one of the unlucky ones at the peak if you don’t. Stay tuned, I’m working on a piece about what the economy ends up looking like,

One thought on “The Grim Reality of COVID-19”